Contenu modal
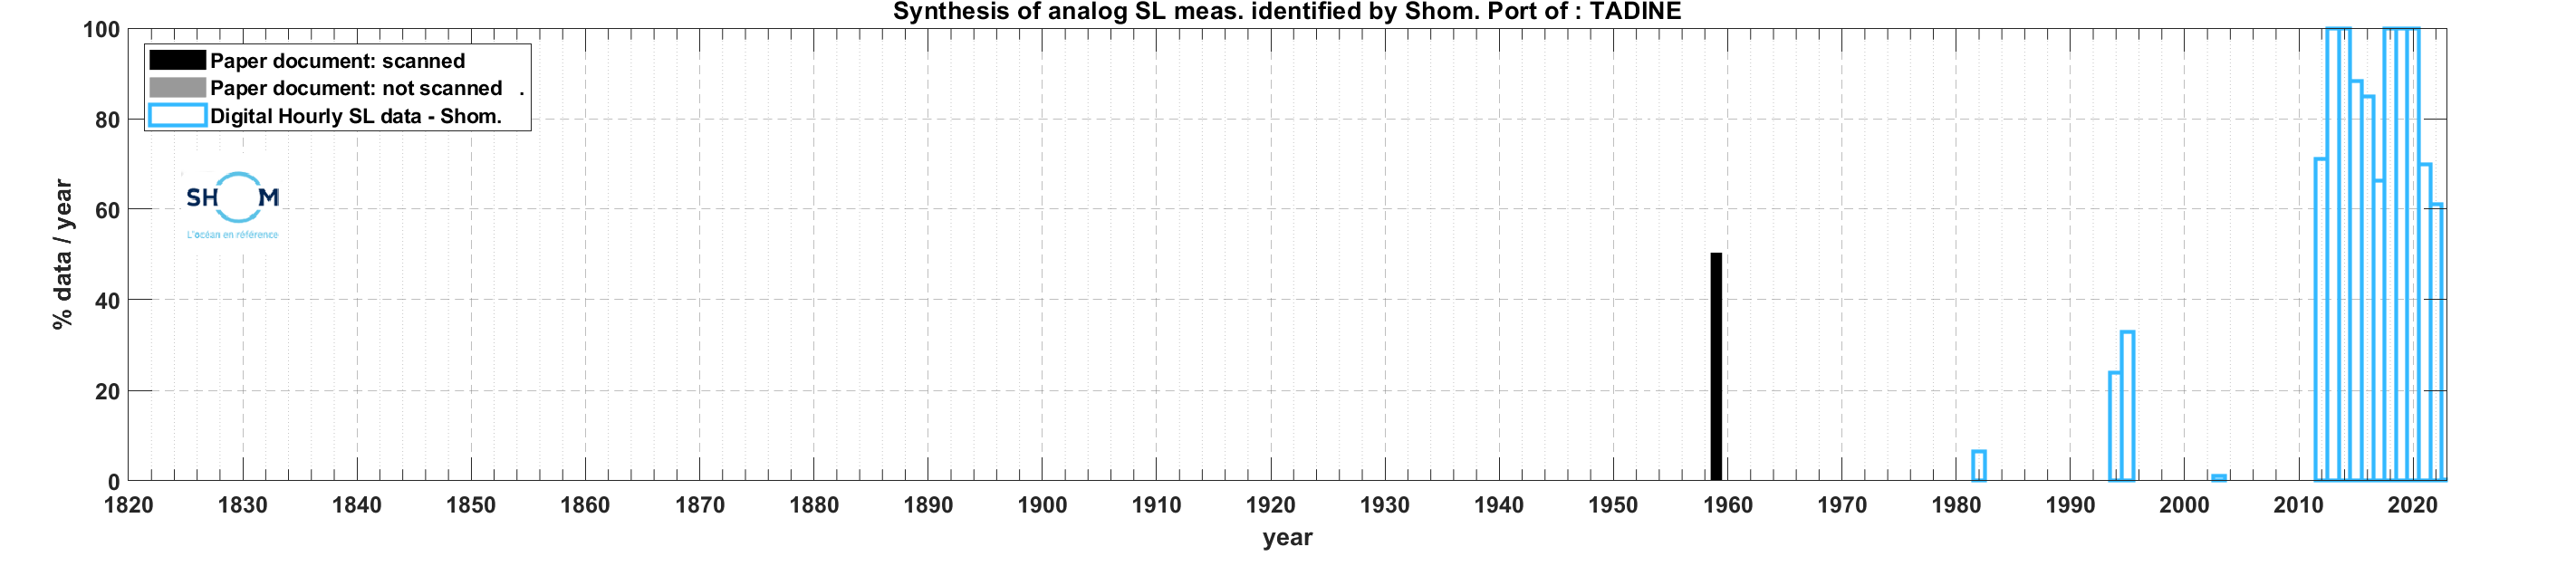
The paper documents identified in the summary barplot (grey / black bars) come from the Shom archives. This inventory comes mainly from the shom archives, but documents may also have been identified in external archives (seaport archives, National Institute of Geographic and Forest Information, national archives centers, etc.). It is possible that several types of documents concern the same period (ledger(s)/tide gauge charts) and their stage of dematerialisation (scanned or not) are possibly different: refer to the table below to find out. The digital hourly water levels (blue bars) are those present in the Shom database. These data may correspond to measurements directly acquired in digital format and validated by the Shom (generally post-2000). They also could be the result of digitisation of paper documents carried out in the past for the needs of Shom. In the latter case, it is possible that no paper document is identified while there is digital data (either the documents are not yet inventoried, or these documents are not the property of Shom and therefore not identified during the inventory). Real-time data and recent data can be downloaded: https://data.shom.fr/donnees/refmar/418/download The inventory of Shom archives is in progress. Possibliy, this list could change in future. When documents are ledgers, the sampling frequency is noted if reported during the inventory.