Circulation around La Réunion and Mauritius islands in the South-Western Indian Ocean: a modeling perspective
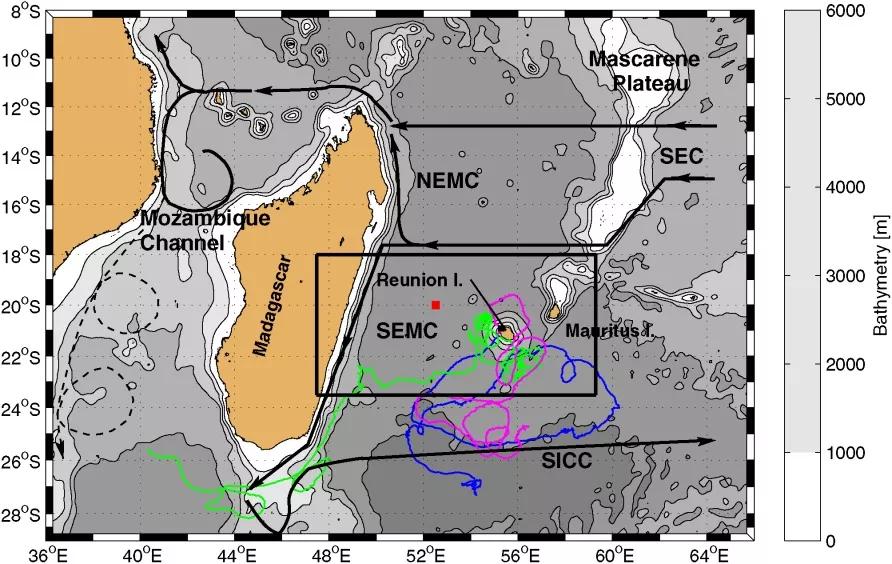
The objective of this study is to document the circulation in the vicinity of La Réunion and Mauritius islands, i.e., within 500 km offshore, on the intraseasonal time scale, using a high-resolution realistic modeling strategy. The simulated sea level anomalies, water mass properties, and large-scale circulation compare favorably with satellite and in situ observations. Our high-resolution simulation suggests that the currents around the islands are maximal locally, oriented southwestward, to the southeast of both islands which is not visible in low-resolution satellite observations. It also highlights the high degree of variability of the circulation, which is dominated by westward propagating features. The predominant time scale of variability is 60 days. This coincides with the period of a barotropic mode of variability confined to the Mascarene Basin. The characteristics of the westward propagating anomalies are related to baroclinic Rossby waves crossing the Indian Ocean but only in the long-wave resting ocean limit. Tracking those anomalies as eddies shows that they also have a meridional tendency in their trajectory, northward for cyclones and southward for anticyclones, which is consistent with previous studies. Sensitivity experiments suggest that they are predominantly advected from the east, but there is also local generation in the lee of the islands, due to interaction between the circulation and topography.
S. Pous, P. Lazure, G. André, F. Dumas, I. Halo, P. Penven
- JGR Oceans


