The contribution of short-wave breaking to storm surges: The case Klaus in the Southern Bay of Biscay
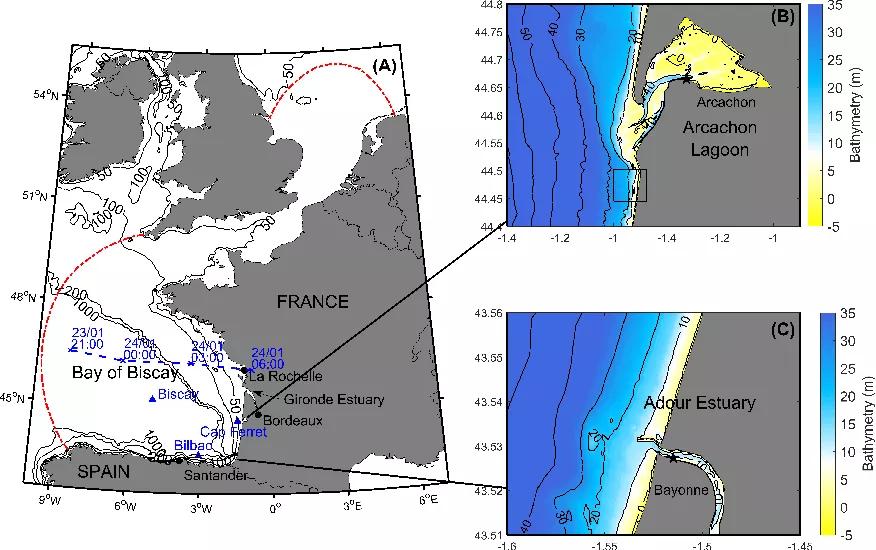
This study investigates the contribution of short-wave breaking to storm surges through a high-resolution hindcast of the sea state and storm surge associated with the extra-tropical storm Klaus. This storm made landfall in January 2009 in the Southern Bay of Biscay and produced the largest storm surges observed in this region over the last 20 years, with 1.70 m in the Arcachon Lagoon and 1.10 m in the Adour Estuary. A fully-coupled 3D modelling system, which uses a vortex force formalism to represent wave-current interactions, is applied with a spatial resolution down to 35 m in the surf zones in order to properly compute the wave-induced setup. Modelling results reveal that the wave setup contributes by up to 40% and 23% to the storm surge peak in the Adour Estuary and the Arcachon Lagoon respectively. Accounting for wave forces in the circulation model improves storm surge predictions by 50 to 60%. This is explained by the dominant role played by wave forces in the momentum balance at the inlets under storm waves. Numerical experiments further reveal that the wave-induced setup can be tidally-modulated, although this phenomenon seems to be site-specific. Finally, a sensitivity analysis highlights the importance of the model grid resolution in the surf zones to correctly resolve the wave setup along open-ocean coasts. Inside the lagoon, the storm surge and wave setup are less sensitive to the grid resolution while tidal propagation cannot be accurately represented with a resolution of 1000 m, which is typically used in operational storm surge forecast.
L. Lavaud, X. Bertin, K. Martins, G. Arnaud, M.-N. Bouin
- Ocean Modelling, volume 156


