Drivers of tidal characteristic changes in north western France: a statistical analysis
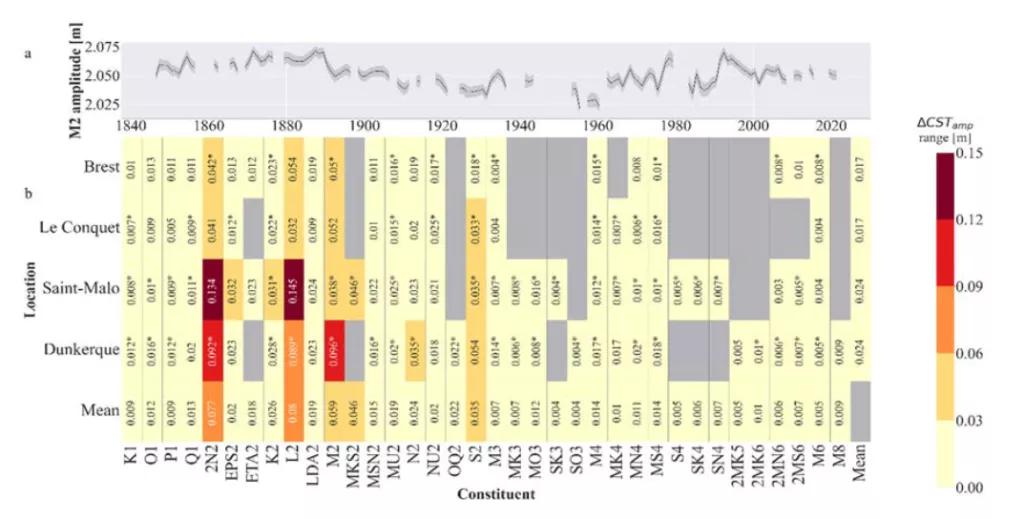
Tides are changing on human timescales, and an understanding of reasons for these changes is important for inundation risk assessments and coastal defence planning. Tides are often regarded as astronomically generated phenomena, however recently published literature has investigated changes in tidal characteristics driven by non-astronomical factors. Physical mechanisms of many of these drivers are well understood, however studies assess the impact of a single or limited number of drivers. As such the relative impacts of these drivers are yet unknown. This work aims to investigate the medium to long-term tidal amplitude changes in relation to potential drivers. A statistical approach was developed, and applied to tide gauge data from Brest, Le Conquet, Saint-Malo and Dunkerque. This approach is designed to conduct comparative model fit analysis between competing multivariate linear regression models of tidal characteristics. The five main potential causes of tidal change investigated were: mean sea level, pressure-driven atmospheric storm surge, wind, waves and stratification. Annual mean and standard deviation are considered for storm surge, wind and wave data in order to represent the average value over the year and the intra-annual variability. Models of constituent amplitudes were constructed using every combination of drivers. The best models were selected using the Bayesian Information Criterion, and models displaying a negative R2 or non-significant correlation were discarded. The results suggest the inverse barometer effect (a proxy of atmospheric storm surges) to be among the most commonly occurring drivers in models of tidal amplitudes for all 4 sites. These preliminary results will be further investigated using a hydrodynamic modelling approach.
J. Challis, D. Idier, G. Wöppelmann, G. André, R. Legouge, J. Rohmer
- Paralia - XVIIèmes Journées Nationales Génie Côtier – Génie Civil, Chatou

