Improving storm surge and wave forecasts from regional to nearshore scales
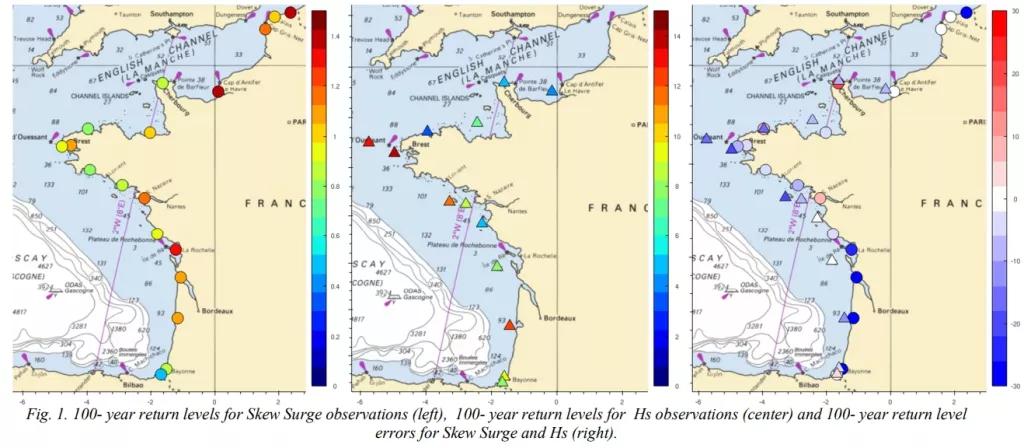
Submersion risks assessment requires different tools and methods from regional to coastal scales. The Shom’s strategy relies on numerical modelling and observational systems applied in a challenging multi-scale context. At regional scales, storm surge and wave models Hycom and Wavewatch III, bathymetric digital terrain models (DTMs) and observational tide/buoy networks used within the operational national storm surge service (Homonim project with Météo-France) are presented, as well as their applications in climatological 40-year hindasts. At coastal scales, coupling between models at decametric resolutions is required for better forecasting of coastal processes (currents/levels and wave interactions). The aim is to improve knowledge of marine hazards locally, and to develop infra-departmental warning systems based on real time flooding forecasts or statistical risk management tools. The development of such tools requires fine scale topo-bathymetric DTMs and dedicated oceanographic campaigns for model validation. To combine regional to coastal scales and improve numerical performance, the modelling strategy will soon be based on a new numerical model from the TOLOSA library (TOols Library for unstructured Ocean models and Surge Applications). This state-of-the-art numerical code, that handles many types of numerical schemes, physical formalisms and meshes, should lead to ultra-high resolution forecasting capacities, allowing for finer processes studies and forecasts (wave setup, port oscillations, infragravity waves, estuarine dynamics, overflows).
A. Pasquet, H. Michaud, L. Seyfried, R. Baraille, L. Biscara, Y. Krien, D. Jourdan
- 9ᵗʰ EuroGOOS Conference, Virtual Edition

