Short-term forecasting of saltwater occurrence at La Comté River (French Guiana) using a kernel-based support vector machine
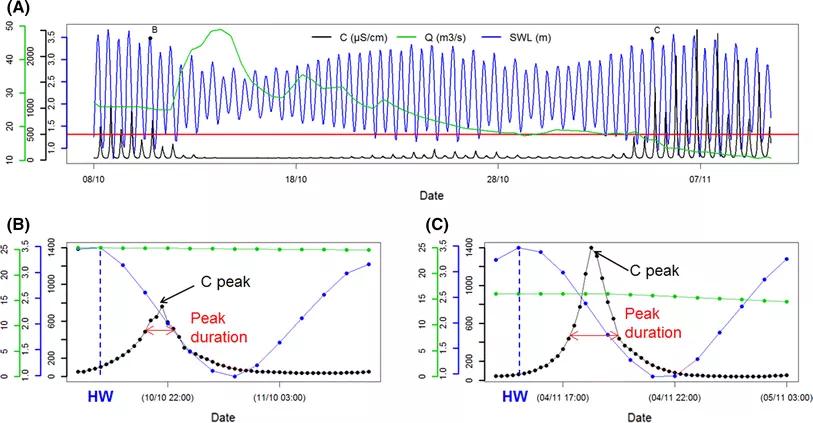
Saltwater intrusion into rivers is a major concern for freshwater exploitation and management in French Guiana (South America). To detect and analyse saltwater occurrence, a permanent station was installed on La Comté River to measure the electrical conductivity C. The objective of the present study was twofold. First, the temporal link between C, sea water level SWL and river discharge Q was explored during the dry seasons from 2009 to 2012 (total measurement duration of ~6 months). A lag of 3 h between C and SWL was evidenced (i.e. the C peaks are delayed by 3 h with high water conditions), as well as the co-occurrence of sea water intrusion with the low Q period. Second, a data-driven approach was set up through a kernel-based support vector machine SVM technique to forecast two events: (1) the forthcoming maximum value of C (for the next 3 h) exceeds 500 µS/cm; (2) C exceeds 500 µS/cm during more than 2 h. One potential drawback of such a data-driven approach is to fail to predict outside the range of calibration: this issue was thoroughly explored by means of an intensive bootstrap-based test exercise. It was showed that SVM has very high degree of predictive capability with accuracy and area under receiver operator curve above 90% in average. We additionally analyse the practical implementation of the SVM model with comparison to alternative popular classification techniques (logistic regression, random forest, linear and quadratic discriminant analysis): the SVM strength is to provide the nonlinear decision boundary without making a priori restrictive assumptions on its shape (like linear or quadratic methods) and without being too sensitive to noisy observations/outliers. Yet this strength can turn to be a weakness unless a careful examination of the shape is done from a physical perspective.
J. Rohmer, N. Brisset
- Environmental Earth Sciences, volume 76


