Filtrer les publications
Barotropic and baroclinic tides increase primary production on the Northwest European Shelf
High biological productivity and the efficient export of carbon-enriched subsurface waters to the open ocean via the continental shelf pump mechanism make mid-latitude continental shelves like the northwest European shelf (NWES) significant sinks for atmospheric CO2. Tidal forcing, as one of the regionally dominant physical forcing mechanisms, regulates the mixing-stratification status of the water column that acts as a major control for biological productivity on the NWES.
J. Kossack, M. Mathis, U. Daewel, Y. J. Zhang, C. Schrum
Frontiers in Marine Science

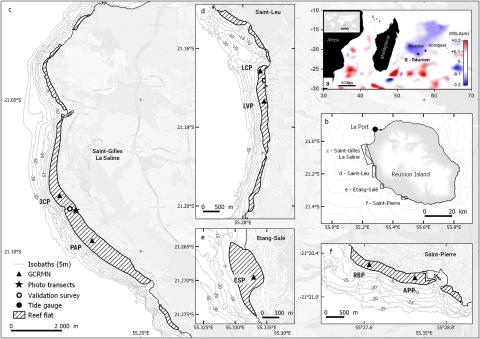
Negative sea level anomalies with extreme low tides in the South-West Indian Ocean shape Reunion Island’s fringing coral reef flats
Among induced mass-mortality events on coral reef, extreme low tides may ultimately lead to considerable reef community deaths on intertidal reef flats due to unusually long and significant aerial exposure. Here, we report an extensive coral mortality event induced by a negative sea level anomaly (nSLA) that occurred across Reunion Island during the austral winter season between June and October 2015 preceding the 2015–2016 El Niño Southern Oscillation (ENSO) event. The nSLA was strong and long in duration with a rapid drop of 35 cm in the mean sea level over a one-month period.
L. Hoarau, P. Mouquet, M. Ropert, A. Cuvillier, L. Massé, S. Bonhommeau, L. Bigot, B. Cauvin, K. Pothin, T. Bajjouk
Ecological Indicators, volume 154
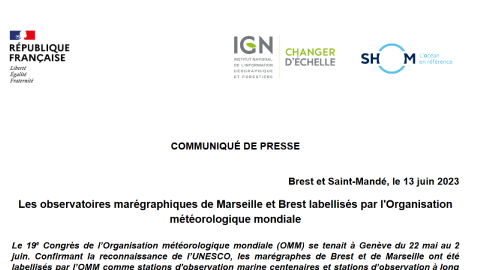
Les observatoires marégraphiques de Marseille et Brest labellisés par l'Organisation météorologique mondiale
Le 19e Congrès de l’Organisation météorologique mondiale (OMM) se tenait à Genève du 22 mai au 2 juin. Confirmant la reconnaissance de l’UNESCO, les marégraphes de Brest et de Marseille ont été labellisés par l’OMM comme stations d'observation marine centenaires et stations d’observation à long terme.
IGN - Shom
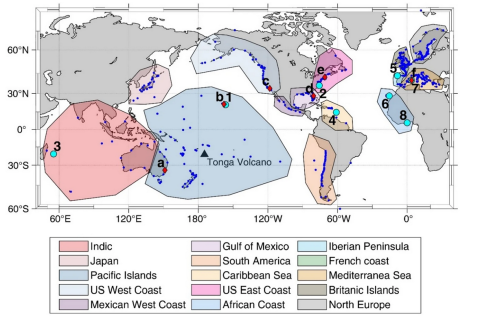
Observational study of the heterogeneous global meteotsunami generated after the Hunga Tonga–Hunga Ha'apai Volcano eruption
The Hunga Tonga–Hunga Ha’apai volcano eruption of January 15th 2022 generated a global atmospheric and oceanic response that was recorded by an unprecedented amount of sensors. The eruption caused an atmospheric perturbation that travelled as a Lamb wave surrounding the Earth at least 3 times, and was recorded by hundreds of barographs worldwide. The atmospheric wave showed complex patterns of amplitude and spectral energy content, although most of the energy was concentrated in the band (2–120 min).
J. Villalonga, À. Amores, S. Monserrat, M. Marcos, D. Gomis, G. Jordà
Scientific Reports
Multi-GNSS Combination Multipath Reflectometry Based on IVMD Method for Sea Level Retrieval
Sea level monitoring is particularly important in coastal areas that are vulnerable to marine disasters. It was recently demonstrated that the global navigation satellite system multipath reflectometry (GNSS-MR) technique, which uses multipath signals reflected from the sea, can be applied to determine the sea level. However, this approach does not provide sufficient accuracy or equally spaced sampling to meet the actual sea level monitoring requirements for certain stations.
R. Li, Y. Wen, X. Wang, H. Xu
Remote Sensing

Water-level changes and subsidence rates along the East Sea coastline of the Saigon-Dong Nai River Estuary and the Mekong Delta
Southeast Asian deltas are highly threatened areas for flooding as a response to the combined effects of natural compaction and subsidence exacerbated by human impacts, e.g. oil, gas and water extraction, retention of sediment discharge due to river damming and sand mining, land use changes, sea-level rise and storm-induced water-level setup. Tide-induced water-level fluctuations on different time- and spatial scales, seasonal variations of freshwater runoff and sea-level setup can amplify the impact of sea-level rise and of storm surges on the coastal environment and its inhabitants.
T. C. Nguyen, K. Schwarzer, K. Ricklefs
Estuarine, Coastal and Shelf Science, volume 283
Impact of an exceptional winter flood on benthic oxygen and nutrient fluxes in a temperate macrotidal estuary: Potential consequences on summer deoxygenation
Despite 20 years of control on eutrophication, episodes of summer hypoxia still occur in the Loire estuary, impacting water quality and posing a key scientific and management challenge. This work aimed to quantify the contribution of the benthic compartment to hypoxia in the Loire estuary by direct measurement of water–sediment fluxes and an in-depth understanding of the seasonal variations of oxides and phosphorus stocks.
V. Hulot, E. Metzger, A. Thibault de Chanvalon, A. Mouret, S. Schmidt, B. Deflandre, S. Rigaud, E. Beneteau, N. Savoye, P. Souchu, Y. Le Merrer, G. M. Maillet
Frontiers in Marine Science

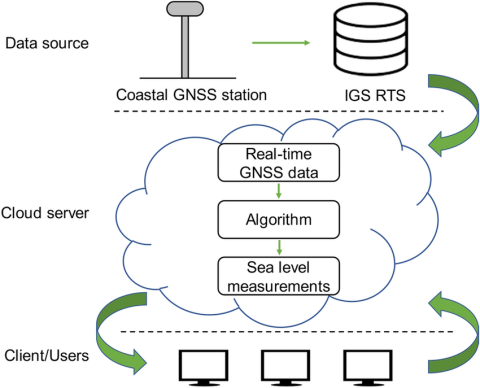
Cloud-based near real-time sea level monitoring using GNSS reflectometry
In addition to traditional tide gauges, the ground-based global navigation satellite system reflectometry (GNSS-R) that utilizes signal-to-noise ratio data from a single GNSS receiver has become another promising alternative for sea level monitoring. However, its application is limited by retrieval precision, especially in large tidal variation environments. On the other hand, previous studies have focused on performance improvement by using post-processing strategies, which cannot support practical (near-) real-time applications.
Z. Liu, L. Du, P. Zhou, X. Wang, Z. Zhang, Z. Liu
GPS Solutions, volume 27, article 65
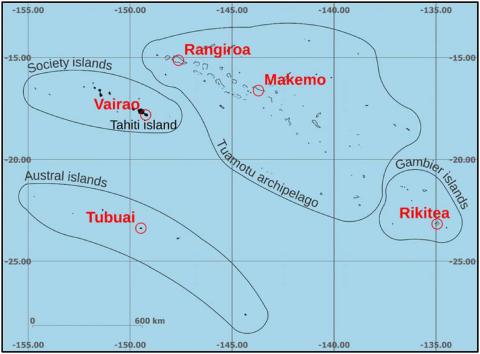
Combination of Tsoft and ET34-ANA-V80 software for the preprocessing and analysis of tide gauge data in French Polynesia
Since 2008 a network of five sea-level monitoring stations was progressively installed in French Polynesia. The stations are autonomous and data, collected at a sampling rate of 1 or 2 min, are not only recorded locally, but also transferred in real time by a radio-link to the NOAA through the GOES satellite. The new ET34-ANA-V80 version of ETERNA, initially developed for Earth Tides analysis, is now able to analyze ocean tides records.
B. Ducarme, J.-P. Barriot, F. Zhang
Geodesy and Geodynamics, volume 14