Filtrer les publications
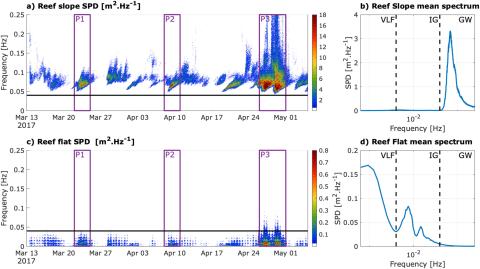
Water Level Modulation of Wave Transformation, Setup and Runup Over La Saline Fringing Reef
Coral reefs represent an efficient natural mechanical coastal defense against ocean waves. The focus of this study is La Saline fringing coral reef, located in the microtidal West of La Réunion Island in the Indian Ocean, frequently exposed to Southern Ocean swell and cyclonic events. The aim is to provide a better understanding of the reef's coastal defense characteristics for several Southern Ocean swell events. Pressure sensors were placed across the reef to measure water level fluctuations and to study wave transformation.
W. Bruch, E. Cordier, F. Floc'h, S. G. Pearson
JGR Oceans, volume 127
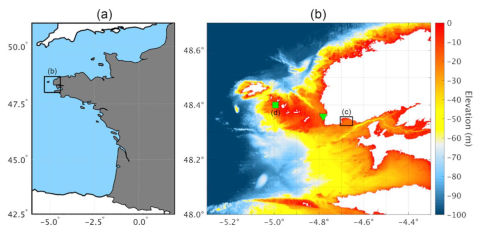
Determination of weather-induced short-term sea level variations by GNSS reflectometry
We propose to derive local sea level variations by using the Signal-to-Noise Ratio (SNR) of the GNSS reflected signals at four GNSS single antenna sites (ILDG, TAR0, FFT2, LYTT) located at different latitudes. For these sites representing various ocean conditions (waves, tides, storm surges, etc…), tides estimates by SNR are highly consistent to tide gauges records as highlighted by tidal harmonic analysis, with a Root-Sum-Square (RSS) ranging from few centimeter in micro-tidal environment to near a decimeter in macro-tidal environment.
T. Gravalon, L. Seoane, G. Ramillien, J. Darrozes, L. Roblou
Remote Sensing of Environment, volume 279

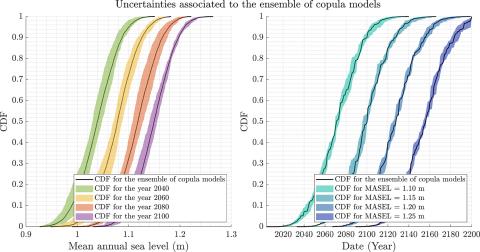
A locally relevant framework for assessing the risk of sea level rise under changing temperature conditions: Application in New Caledonia, Pacific Ocean
Sea level rise is a key feature in a warmer world and its impact can be seen globally. Assessing climate change-induced sea level rise, therefore, is urgently needed particularly in small island nations, where the threats of sea level rise are immediate, but the level of preparedness is low. Here, we propose a stochastic simulator to link changes in Mean Annual Temperature (MAT) to Mean Annual Sea Level (MASEL) at the local scale. This is through what-if scenarios that are developed based on the association between local temperature and sea level.
M. Kaemo, E. Hassanzadeh, A. Nazemi
Science of The Total Environment, volume 834
Spatio-temporal variability of the morpho-sedimentary dynamics observed on two gravel beaches in response to hydrodynamic forcing
This article aims to investigate the 3D morpho-sedimentary dynamics of two gravel beaches in relation to hydrodynamic forcing, using a multi-sensor approach. Study sites, namely Etretat and Hautot-sur-Mer, are both located in Normandy, France. Thus, they face similar wave conditions of the English channel's eastern side, with megatidal ranges and channelized wave orientations.
A. Saloy, I. Turki, N. Lecoq, C. L. Solano, B. Laignel
Marine Geology, volume 447

A long-term dataset of topography and nearshore bathymetry at the macrotidal pocket beach of Porsmilin, France
Long-term datasets documenting the evolution of coastal forms and processes, through the provision of recurring beach as well as shoreface morphological observations and accompanying time-series of environmental controls, remain difficult to collect and are rarely made available. However, they are increasingly needed to further our understanding of coastal change and to improve the models that will help planning what our future coast will be.
S. Bertin, F. Floc'h, N. Le Dantec, M. Jaud, R. Cancouët, M. Franzetti, V. Cuq, C. Prunier, J. Ammann, E. Augereau, S. Lamarche, D. Belleney, M. Rouan, L. David, A. Deschamps, C. Delacourt, S. Suanez
Scientific Data 9, article 79
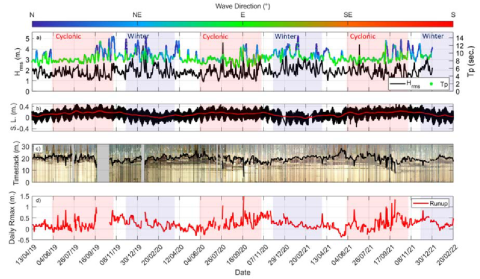
Seasonal runup variability at a reef-lined beach: field assessments in the Caribbean
The proposed article deals with the assessment of coral reef impact on runup-induced coastal flooding over a two years and 10 months period at Anse Maurice, a reef-fringed pocket beach located at Guadeloupe Island, in the Caribbean region. The reef is mainly constituted by complex structures of Acropora Palmata dead colonies. Daily maximum marine inundation was assessed using a fixed video system. Daily Highest Runups (DHR) remains primarily correlated to individual storm event as extreme runups are observed in correlation with storm swells.
T. Laigre, Y. Balouin, A. Nicolae-Lerma, N. Valentini, D. Villarroel-Lamb, M. Moisan, Y. De la Torre
Paralia - XVIIèmes Journées Nationales Génie Côtier – Génie Civil, Chatou
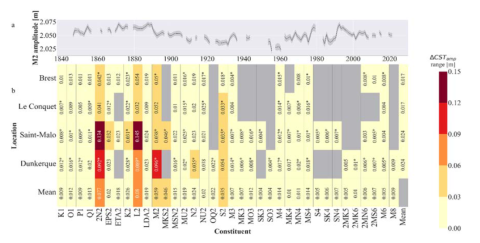
Drivers of tidal characteristic changes in north western France: a statistical analysis
Tides are changing on human timescales, and an understanding of reasons for these changes is important for inundation risk assessments and coastal defence planning. Tides are often regarded as astronomically generated phenomena, however recently published literature has investigated changes in tidal characteristics driven by non-astronomical factors.
J. Challis, D. Idier, G. Wöppelmann, G. André, R. Legouge, J. Rohmer
Paralia - XVIIèmes Journées Nationales Génie Côtier – Génie Civil, Chatou
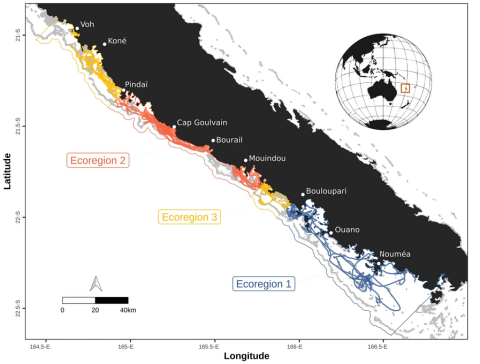
Ecoregional and temporal dynamics of dugong habitat use in a complex coral reef lagoon ecosystem
Mobile marine species display complex and nonstationary habitat use patterns that require understanding to design effective management measures. In this study, the spatio-temporal habitat use dynamics of the vulnerable dugong (Dugong dugon) were modelled from 16 satellite-tagged individuals in the coral reef lagoonal ecosystems of New Caledonia, South Pacific.
S. Derville, C. Cleguer, C. Garrigue
Scientific Reports 12, article 552
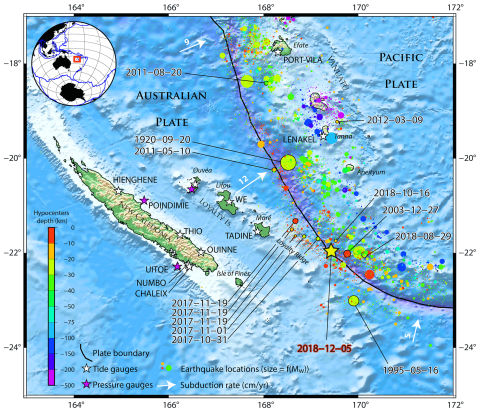
The Mw 7.5 Tadine (Maré, Loyalty Islands) earthquake and related tsunami of 5 December 2018: seismotectonic context and numerical modeling
On 5 December 2018, a magnitude Mw 7.5 earthquake occurred southeast of Maré, an island of the Loyalty Islands archipelago, New Caledonia. This earthquake is located at the junction between the plunging Loyalty Ridge and the southern part of the Vanuatu Arc, in a tectonically complex and very active area regularly subjected to strong seismic crises and earthquakes higher than magnitude 7 and up to 8.
J. Roger, B. Pelletier, M. Duphil, J. Lefèvre, J. Aucan, P. Lebellegard, B. Thomas, C. Bachelier, D. Varillon
NHESS, volume 21